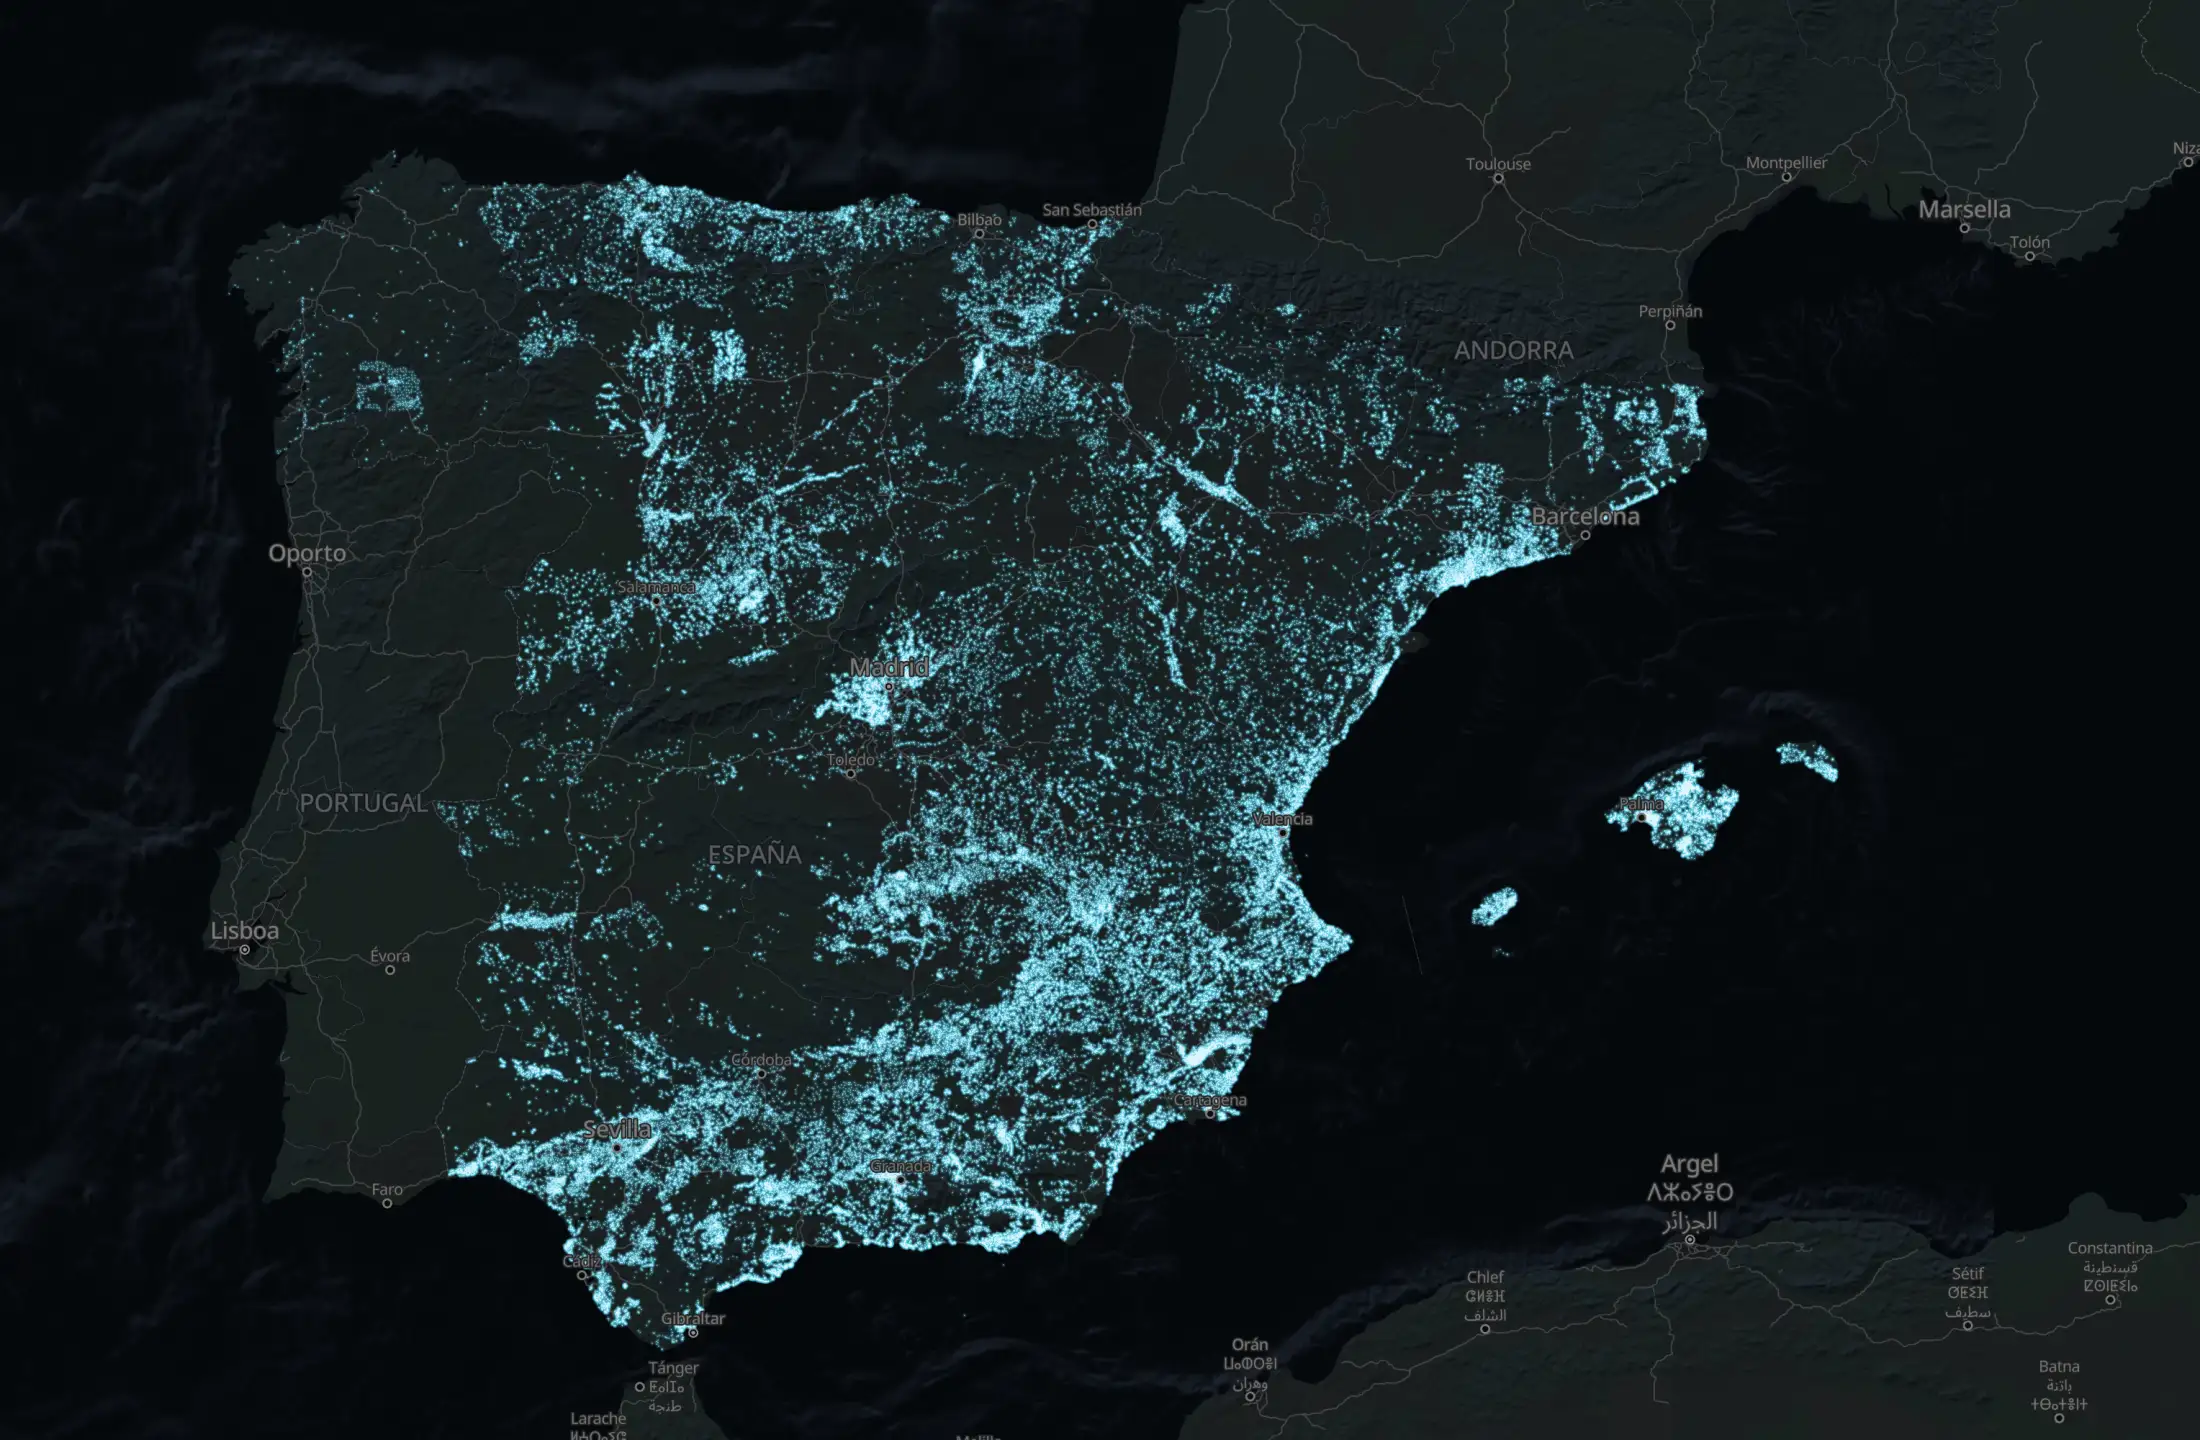
Click any point in Spain and in seconds it is checked against official data: the water underground and whether the rock holds it, flood risk, protected areas, radon, wildfire history and mobile coverage. Free, with no sign-up, you see at once how many things need a closer look. The full answer for one plot, with what to do next and what it costs, is its Dossier.
Catastro, IGME, MITECO, IGN, EEA, Copernicus. The data the public bodies themselves publish, on one map.
No plot yet? Find the towns where you can build, with water near the surface →
Paste a cadastral reference or a town name. How many findings it has appears right here — no sign-up, no email.
Spain in 1956 · a map layer
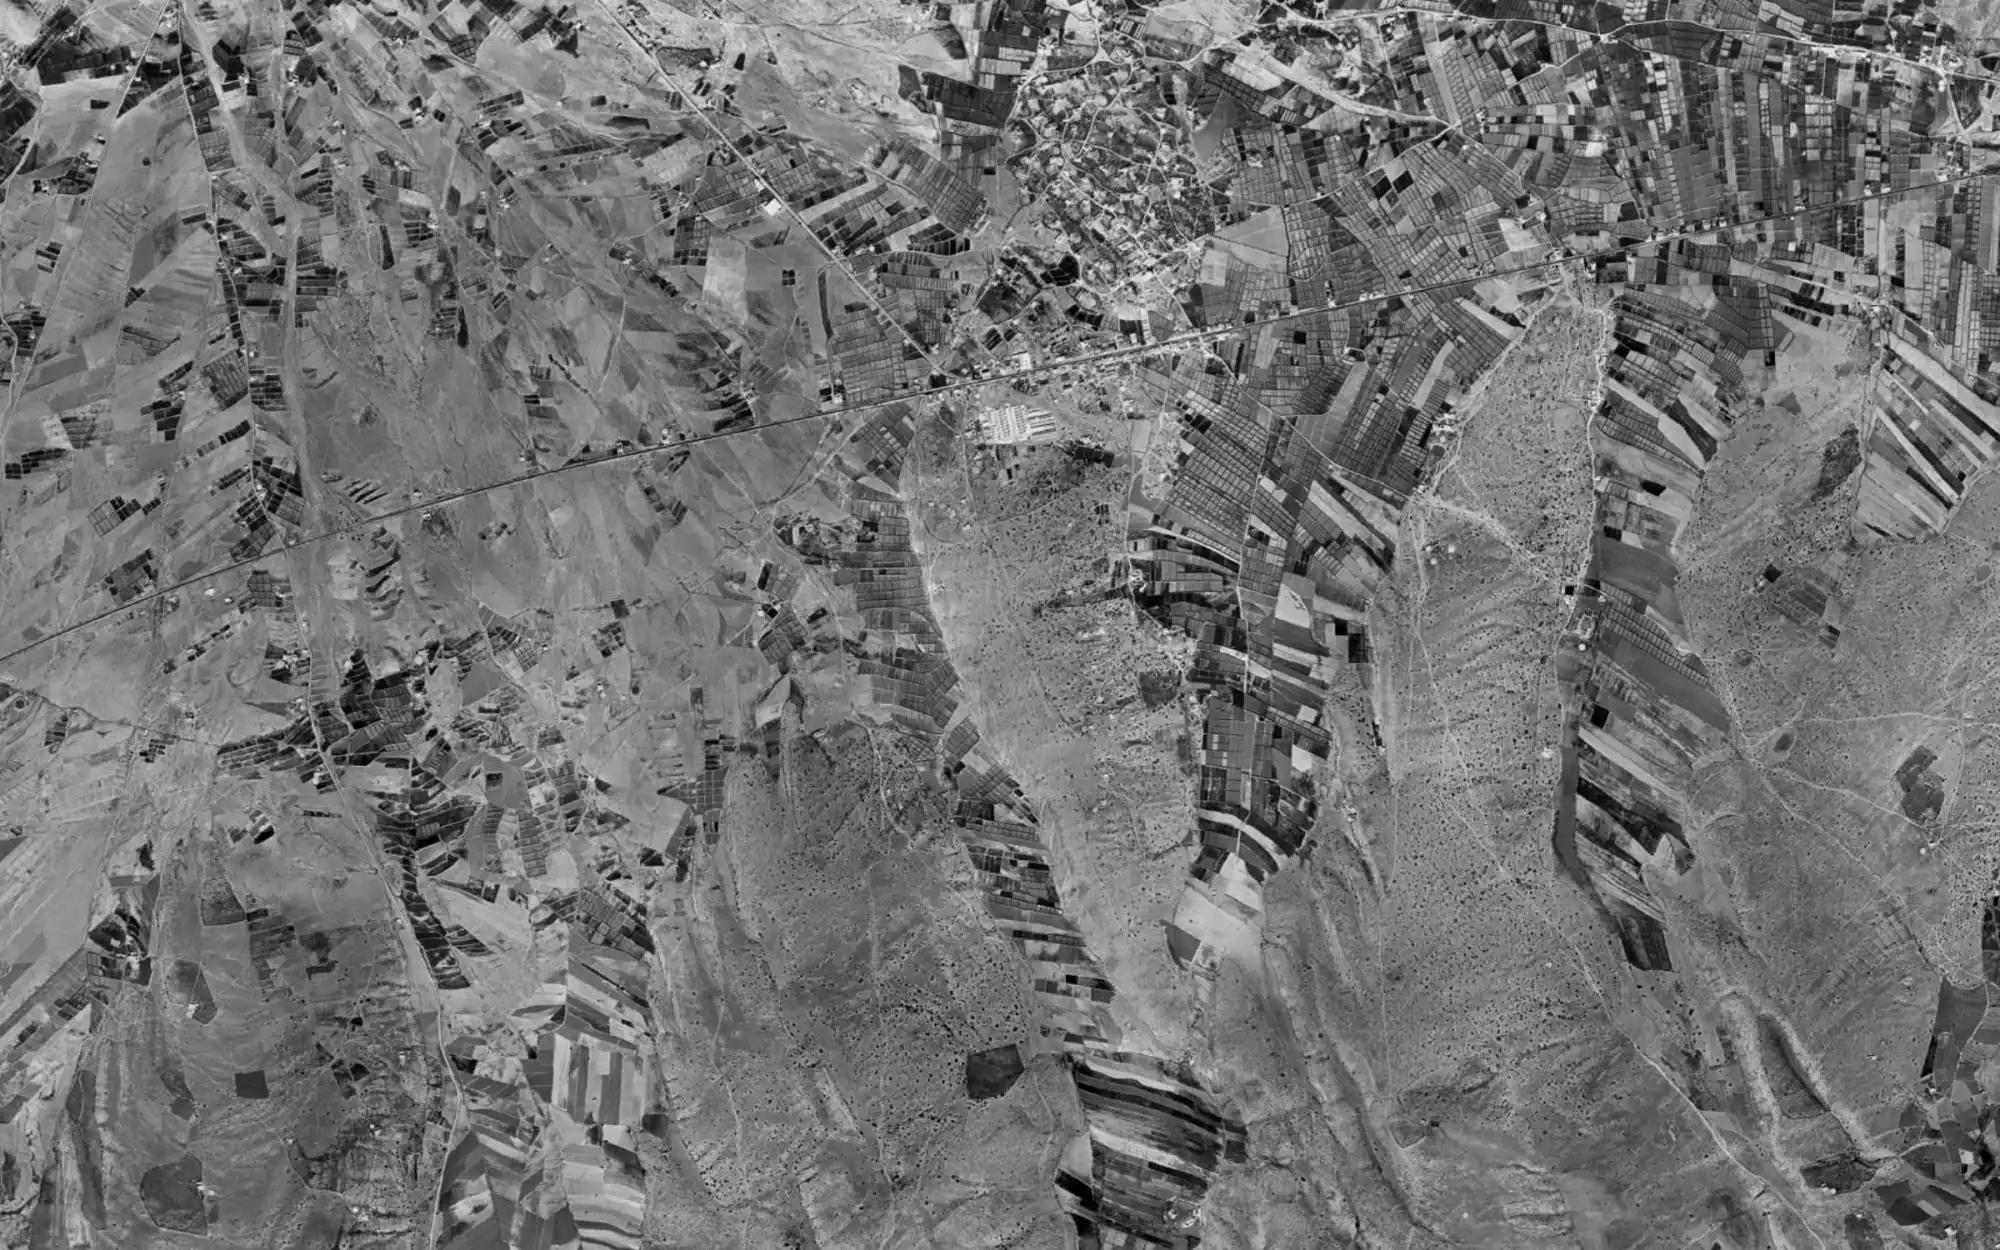
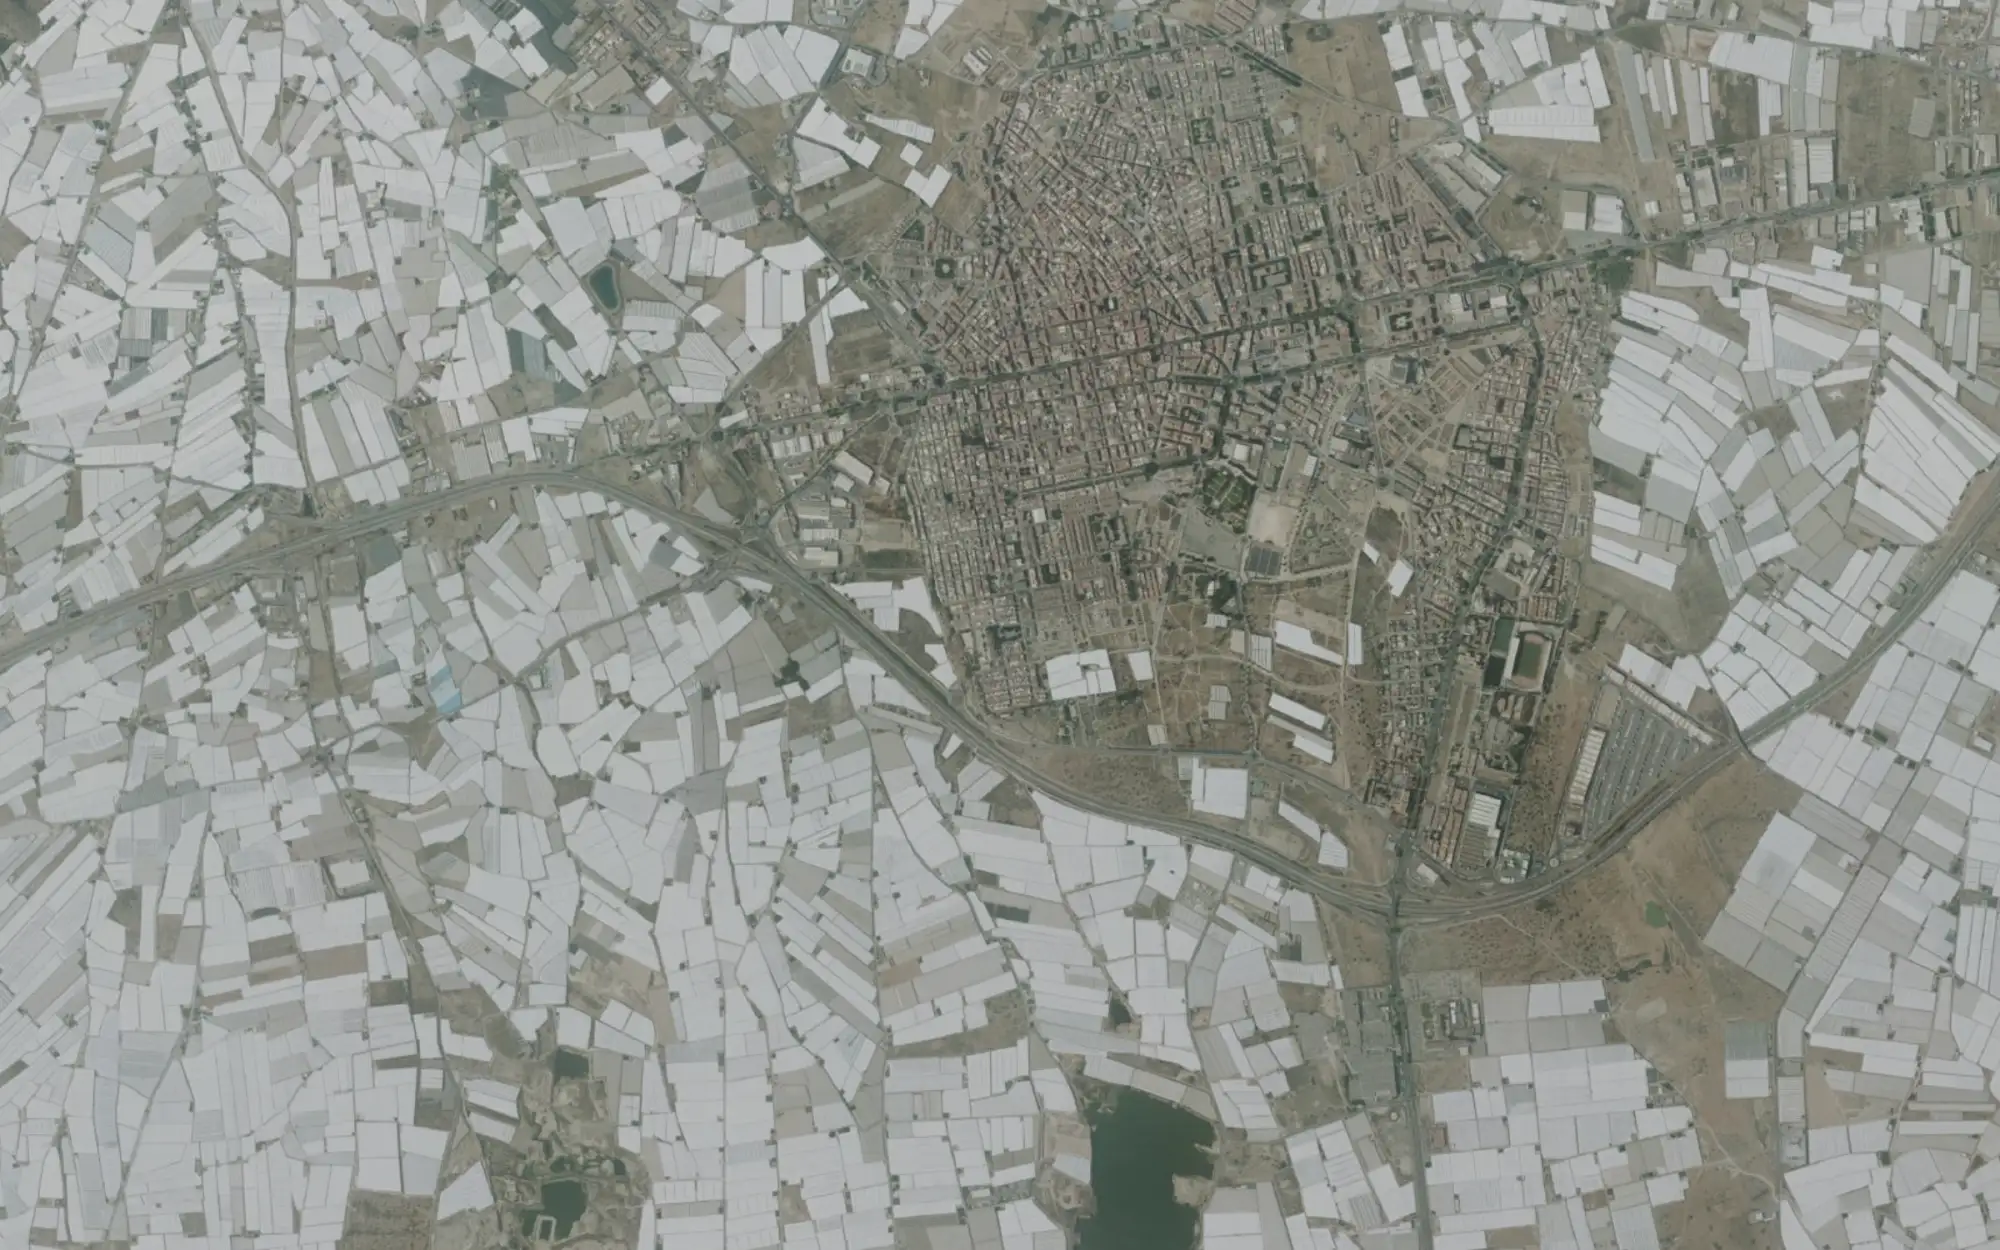
El Ejido, Almería. In 1956: fields and bare hills around a small village. Today: an unbroken sea of greenhouses, over an aquifer in poor quantitative state (EEA 2022). The 1956 aerial survey can be opened for any point in Spain.
Two real plots, with the figures this site gives. The one that looks better has more red flags.
| VillagatónLeón · green hills · cheap land | Fresneda de AltarejosCuenca · looks drier | |
|---|---|---|
| Rain | 687 mm/yr | 432 mm/yr |
| Rock beneath the plot | practically impermeable (risk) | low permeability, local water |
| Nearest spring | 1,345 m | 2,887 m |
| Wildfires within 5 km | 10 · 108 ha · latest 2026 (risk) | none |
| Radon | zone 2, the highest (risk) | zone 0, the lowest |
| Fibre in the municipality | 0% (risk) | 91.6% |
| Frost days | 101 a year | 71 a year |
| Red flags | 4 | 0 |
León gets 60% more rain, and has four red flags to Cuenca’s none. The rock beneath it is practically impermeable, so the ground stores little of that rain. The hills burn: ten fires since 2016, the latest this year. And the municipality has no fibre. Cuenca looks drier on paper and shows none of these flags.
Seventeen layers, four depths, from sky to subsurface. Each from the body that publishes it. Roads, power lines and a few others in the report come from OpenStreetMap, and say so. Nothing scraped from anyone else’s site.
| Layer | Source | Replaces |
|---|---|---|
| Solar yield | PVGIS, European Commission (JRC) | the installer’s estimate |
| Climate 2050 | AdapteCCa · SSP2-4.5 · 2041–2070 | the PNACC reports |
| Yearly rainfall | ERA5-Land, Copernicus · 1991–2020 | AEMET’s tables |
| Layer | Source | Replaces |
|---|---|---|
| Natura 2000 | MITECO · December 2025 | asking the regional government |
| Wildfire history | EFFIS · burnt areas since 2016 | looking fires up one by one in the EFFIS viewer |
| Mobile & fibre | SETID · 2025 · by municipality | the operators’ coverage maps |
| Layer | Source | Replaces |
|---|---|---|
| Cadastral parcels | Catastro · live | sede.catastro.gob.es |
| Aerial photos | IGN PNOA · live | — |
| Spain in 1956 | American flight · IGN · live | ordering the historic flight from IGN |
| Buildings on rustic land | Catastro | the Catastro viewer, parcel by parcel |
| Flood zones | SNCZI · MITECO · 10 to 500 years | reading SNCZI’s PDF maps |
| Layer | Source | Replaces |
|---|---|---|
| Hydrogeology 1:200,000 | IGME | IGME’s paper sheets |
| Wells & springs 139,593 | IGME BDAguas | asking the river basin authority |
| Groundwater bodies | EEA 2022 · MITECO declarations | the river basin plans |
| Radon zones | Building Code CTE DB-HS6 | the code’s annex |
| Seismicity | NCSE-02 · by municipality | the standard’s annex |
| Mining rights | Catastro Minero · MITECO | the mining register |
Municipal data covers all 8,132 municipalities in Spain. The map works in Spanish, English and German.
Rule a plot out from your desk, before the drive and the phone calls.
Answer on the spot about water, flooding and restrictions, instead of “I’ll get back to you”.
Search by what matters, not by scrolling listings.
Searching plots by criteria, reports for clients, access to the data: that’s what we’re building next. If you work with land in Spain, tell us what you need — it decides what comes first.
hello@discoverland.org